Elemental Analysis of Lithium Salts Utilizing ICP-MS Technology, Integrated with Argon Gas Dilution (AGD) Methodology

Product Manager
Sandra Forbes
Introduction
Lithium batteries stand as one of the paramount electrochemical energy storage systems in contemporary use. Their exceptional energy density and sizable storage capacity have propelled their swift adoption in portable electronics and diverse industrial applications, culminating in their emergence as the prevailing technology for electric vehicle battery packs. Amidst the burgeoning electric vehicle market, the demand for vast quantities of high-performing, robust, and safe lithium-ion batteries with enduring lifespans escalated. Consequently, this has sparked intensified global research aimed at advancing battery technology, coupled with a remarkable expansion in manufacturing capacity and a heightened need for accurate, precise, and dependable battery material analysis.
Within the upstream and midstream of the lithium-ion battery industry's value chain, the quality assurance of raw materials and finished goods necessitates the employment of instrumental analysis techniques to scrutinize impurities and physical properties, thereby ensuring the conformity of the final products with performance and safety standards. This specifically encompasses lithium salts, such as lithium carbonate (Li2CO3) and lithium hydroxide (LiOH).
At present, the purity of most lithium salts is typically analyzed using inductively coupled plasma optical emission spectroscopy (ICP-OES), a robust analytical approach capable of detecting impurities across a wide concentration range from sub µg∙L-1 to percentage levels. Given the impending demand for batteries with enhanced performance and longevity, there will be a growing need for higher purity raw materials. In the coming years, it is anticipated that many manufacturers' purity requirements for lithium salts will likely rise to 99.99% (or even higher), and this trend is expected to persist. Achieving such purity levels poses a challenge to current analytical methods, as not only will the detection limits need to be lowered, but also the number of elements to be analyzed is likely to increase, encompassing those typically present at trace and ultra-trace levels. Given these requirements, the analysis of key lithium battery raw materials is likely to gradually shift from ICP-OES to ICP-MS.
This application note outlines the analysis of three distinct lithium salts utilizing the iCAP RQ ICP-MS. The developed method covers a comprehensive list of common impurities, including alkali and alkaline earth elements, transition elements, heavy metals, and lanthanide series elements. In total, the purity assessment encompasses over 60 analytes.
Instrumentation
Utilizing an iCAP RQ ICP-MS with argon gas dilution, we analyzed three samples: two of Li2CO3 and one of LiOH. Battery production raw materials often present a complex matrix, yet sample dilution during preparation is not always preferable due to its associated workload and potential elevation of method detection limits (MDLs), which could hinder the detection of low-concentration impurities. ICP-MS systems typically have limited matrix tolerance, necessitating significant sample dilution before plasma introduction. However, the iCAP RQ ICP-MS addresses this challenge with argon gas dilution (AGD). By utilizing argon gas directly from the instrument, samples can be diluted online, cost-effectively. Samples can be loaded onto the autosampler as received and analyzed promptly, with dilution occurring internally within the instrument. The instrument parameters employed for this application are detailed in Table 1.

Table 1. Instrument parameters
Method performance
To demonstrate the linearity of the instrument, a six-point calibration curve was utilized. This curve, spanning from trace to major elements, was established in a single run, yielding outstanding correlation coefficients surpassing 0.9999.
The detection limits (DLs) in solution were established through the measurement of a reagent blank solution, prepared concurrently with the samples. After analyzing this solution ten times, the Qtegra ISDS Software automatically calculated and reported the instrumental detection limit, utilizing the standard deviation of the repetitions. Since no further dilution was applied to the samples, the instrumental detection limit (IDL) could be readily converted to the method detection limit by multiplying it with the dilution factor (in this case, 200).
Compared to ICP-OES, ICP-MS typically offers detection limits that are at least 3-4 orders of magnitude lower. This enhanced detection power is especially crucial for the analysis of lanthanides, a group of metals with unique chemical properties that are frequently encountered in geological samples in concentrations ranging from µg∙kg-1 or below. Here, the remarkable sensitivity of ICP-MS, coupled with the often negligible lanthanide element backgrounds, enables detection limits in the ng∙L-1 concentration range. Table 2 provides a comprehensive view of the calibration correlation coefficients and detection limits for all target elements.

Table 2. Overview of the correlation coefficients of the calibration plots and achieved detection limits
Raw material results
When examining high-purity materials, it's often necessary to simultaneously analyze both major/matrix elements and impurities, as outlined in this application note. For instance, to assess the purity of lithium salts, a total of 60 elements were measured. To prevent overwhelming detector signals due to the high Li concentration, the lithium content was determined using the less abundant 6Li isotope (7.50%). Three lithium salts were analyzed, with each sample prepared in duplicate for comparison. Table 3 outlines the concentrations of all elements in the three Li salt samples, while Table 4 presents the total impurity level and corresponding purity.
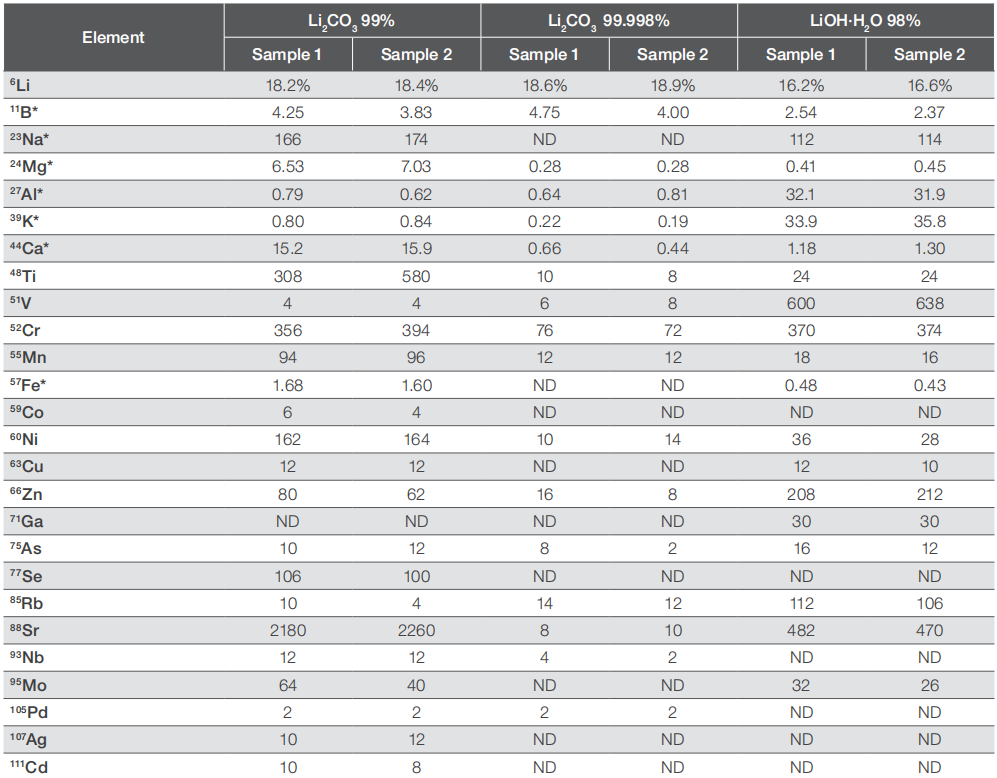
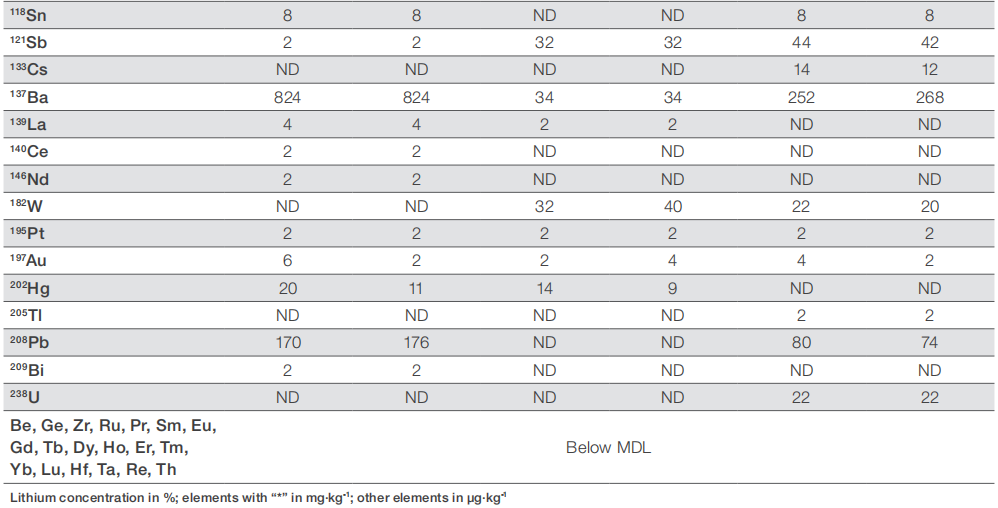
Table 3. Element content in the three different lithium salts
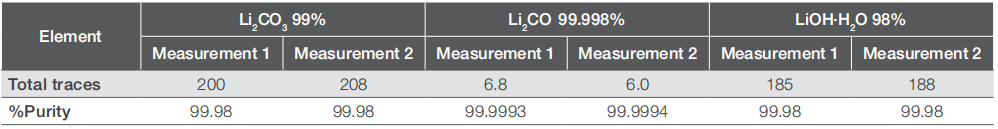
Table 4. Determination of the total trace element amount in each sample (in mg·kg-1)
Overall, the reproducibility and accuracy of the analysis are evident from the consistent results among the individual samples prepared from the three lithium salt samples. While the overall purity of the compounds has been verified, it is apparent that a higher purity does not uniformly correlate with lower impurity levels for each specific analyte. For instance, Li2CO3 with 99.998% purity displays notably lower impurity concentrations for most elements, yet it exhibits similar boron levels compared to the 99% purity variant. Conversely, LiOH with 98% purity shows significantly lower levels of the same analyte. A similar trend is observed for sodium, where the 99.998% Li2CO3 contains no detectable sodium, while the 98% pure LiOH has 30% lower sodium concentrations compared to 99% pure Li2CO3, yet higher concentrations of other elements. These variations likely stem from the distinct origins of the raw lithium salts and the diverse refining processes employed in transforming the raw materials into the final compounds.
Spike recovery test
To validate the accuracy of our method for crucial analytes and rule out potential drifts or matrix effects, a duplicate spike recovery test with two distinct spike levels (0.1 μg·L-1 and 1 μg·L-1) was conducted on all three lithium salt samples.
Our research centered on lanthanides, given their relevance in high-tech electrotechnical applications. Although scarce in nature, the increasing purity demands for high-performance batteries may necessitate the analysis of uncommon analytes in the future. Given their typically low environmental concentrations, lanthanide analysis necessitates a highly sensitive technique. ICP-OES faces challenges in accurately analyzing lanthanides due to the overlap of their characteristic emission wavelengths with interfering spectral lines from other elements, and its detection limits often fall short in practical applications.
Table 5 summarizes the spike recovery results in the three lithium salt samples, demonstrating an excellent overall recovery rate ranging from 90% to 102% across all samples.
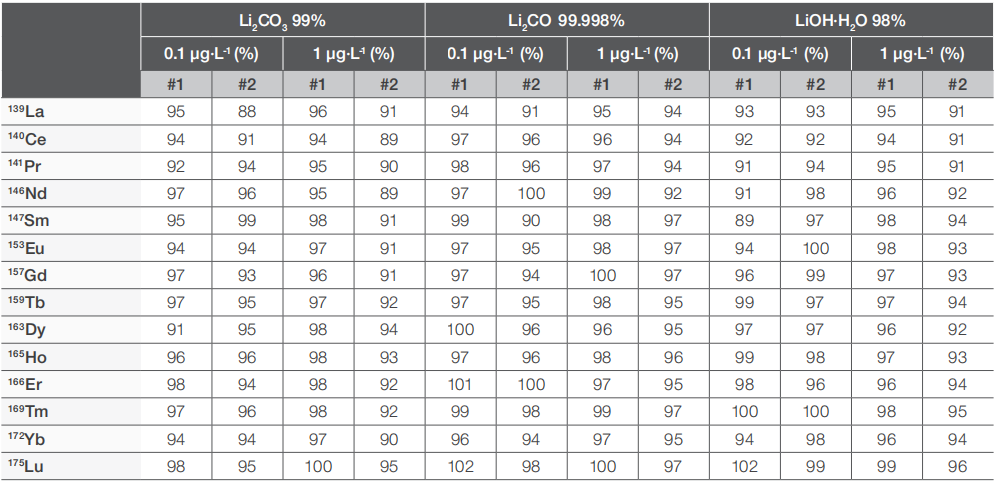
Table 5. Rare earth element (REE) spike recovery results for the lithium salt samples
Quality control procedure and long-term stability
To ensure reliability in analytical testing laboratories, precision and accuracy are paramount, irrespective of batch size or sample diversity. Periodic quality control (QC) standards with known analyte concentrations are typically analyzed to monitor method performance. Additionally, regulated methods often mandate tracking the internal standard's response, which corrects for system drift and matrix effects like signal suppression.
To mimic high-volume sample analysis, a large batch comprising previously analyzed lithium salt samples was scheduled. A QC check (CCV) with 10 μg·L-1 of all measured elements was performed after every 20 unknown samples, verifying accuracy throughout the batch. In summary, 12 CCVs were analyzed in a 280-sample batch over 12 hours. Figure 1 shows the successful acquisition of all QC samples, indicating an average recovery between 98% and 115%.
The internal standard recoveries, automatically displayed by the Qtegra ISDS Software, are depicted in Figure 2. All isotopes used as internal standards exhibited excellent recoveries between 75% and 120% across the analysis duration and various sample matrices. This recovery underscores the stability and accuracy of the run, unaffected by sample matrix effects.
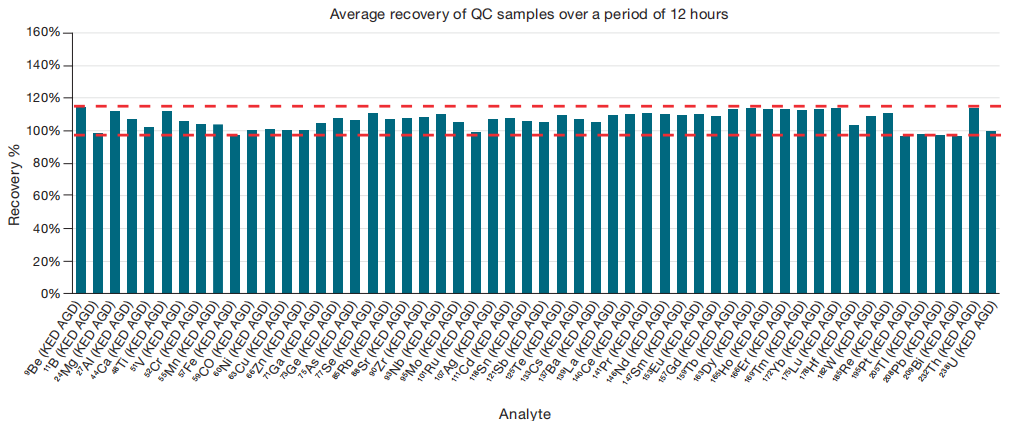
Figure 1. QC sample recoveries during the 12 hour run

Figure 2. Internal standard performance from the analysis of about 280 samples over 12 hours showing recoveries between 75% and 120%
Conclusions
This application note exhibits the capability of the iCAP RQ ICP-MS in analyzing various lithium salts for impurities with unparalleled accuracy and precision. The system's robust nature significantly minimizes sample preparation, enabling samples to be introduced for analysis without further dilution. The crucial components such as the nebulizer, spray chamber, and interface, which operators frequently handle, are readily accessible for disassembly, facilitating maintenance and minimizing downtime. This attribute is particularly crucial when dealing with high matrix samples, including lithium salts.
• The streamlined workflow of the Qtegra ISDS Software facilitates straightforward method development, quality control protocol implementation, and data evaluation.
• Moreover, its expansive linear dynamic range spanning up to 10 orders of magnitude enables precise quantification of both major and trace elements in a single measurement, negating the need for additional sample dilution. This is exemplified by the concurrent analysis of 6Li and trace-level impurities.
• Argon gas dilution (AGD) serves as a solution to overcome challenges associated with samples containing matrix concentrations exceeding the commonly defined limit of approximately 0.2% (m/v) total dissolved solids. This dilution process occurs automatically within the instrument, negating the need for additional sample handling.
• Lastly, the system's robust and consistent analytical performance was demonstrated through 12 hours of uninterrupted acquisition of 280 samples, highlighting its capacity to meet the escalating demands of laboratories supporting expanding production lines.
References
1. Thermo Scientific Technical Note 000387: Resolving the challenges of analyzing samples with high and variable matrix content using argon gas dilution (AGD) with ICP-MS.
Aladdinsci: https://www.aladdinsci.com/