Utilizing ICP-OES for Evaluating the Purity Levels of Lithium Carbonate and Lithium Hydroxide
Product Manager
Sandra Forbes

Introduction
In recent years, the global demand for lithium salts has surged significantly, primarily driven by the rapid expansion of the lithium-ion battery (LIB) market, particularly for the automotive industry. Among the key lithium compounds traded globally, lithium carbonate (Li2CO3) and lithium hydroxide (LiOH) occupy a pivotal position. These compounds are extracted from natural sources like geological ores and underground brines, and are subsequently utilized in various LIB components (Figure 1). While lithium carbonate extraction tends to be more cost-effective, lithium hydroxide is favored due to its low-temperature decomposition properties, which facilitate a more sustainable battery cathode manufacturing process and enhance the durability of the final product.

Figure 1. Simplified schematic of lithium extraction from ores to battery components
Battery and raw material manufacturers need to ensure that all substances used in the production of battery components are tested for the presence of elemental impurities, such as alkaline and alkaline earth elements and transition metals, so that the performance of the end products is not compromised. Purity is a key differentiator that increases material value and ultimately profitability so stringent and regular quality control is essential. Analysis of elemental impurities in battery grade lithium salts is often based on the methods described in Chinese standard GB/T-11064.16-2013 and International Electrotechnical Commission (IEC) 62321 standard where ICP-OES is a suggested technique in both. ICP-OES is considered a key technology for analytical testing of battery materials as it can perform full multi-elemental analysis in a short time and is able to handle a wide variety of potential sample types.
Experimental
Instrument parameters and experimental conditions
The iCAP PRO XP ICP OES Duo instrument was employed to assess 45 trace elements in Li2CO3 and LiOH, aiming to determine the total impurity concentration within the compounds and their salt compositions. Operating in the intelligent full range (iFR) mode with axial plasma viewing, the instrument enables highly sensitive measurements across both the UV and visible spectrum in a single exposure. This significantly reduces sample turnover time, accelerates result delivery, and facilitates cost savings for laboratories. The sample introduction system was configured conventionally for aqueous analysis, with the exception of the torch, which was specifically chosen as a ceramic D-torch. This selection was made to enhance sample matrix tolerance and minimize maintenance requirements, as high purity quartz torches may exhibit signs of damage and devitrification after prolonged exposure to these specific sample types, necessitating frequent replacements. The ceramic D-torch effectively handles both sample types with ease, consistently generating robust and reliable data.
Table 1 outlines the specifics of the sample introduction setup and the typical instrument parameters. The capability of the iCAP PRO Series ICP-OES to simultaneously measure the entire wavelength range enables swift sample analysis, regardless of the number of analytes or wavelengths being measured. In this experiment, a comprehensive quantitative analysis of 45 analytes was achieved with a total runtime of 144 seconds per sample.

Table 1. Instrument configuration and typical operating parameters
Sample preparation
The analysis encompassed two Li2CO3 samples, one with a purity grade of 99.9% and the other with 99.998%, along with a single LiOH (Monohydrate) sample possessing a purity of 98%. Accurate aliquots of 250 ± 2 mg from each sample were precisely weighed into designated sample tubes. Subsequently, 1 mL of HNO3 (Trace Metal grade) was cautiously added to each sample. The samples were then allowed to rest for 15 minutes to ensure the completion of the neutralization reaction. Following this, the samples were further diluted using ultra-pure water until a final volume of 50 mL was attained.
Standards and reference materials
Utilizing single-element standards for individual analytes, a calibration blank and a series of calibration standards spanning a concentration range of three orders of magnitude were prepared in 2% (v/v) HNO3. The specific concentrations of these standards were 50, 200, 500, 1,000, and 2,000 µg·L-1.
To mitigate the interference from easily ionizable elements (EIE) resulting from the high lithium content in the samples, the calibration standards and the calibration blank were matrix-matched and fortified, ensuring a final lithium concentration of 1,000 mg·L-1 in the solutions.
Furthermore, to continuously monitor and adjust for any physical interferences during the analysis, an internal standard solution containing 5 mg·L-1 of yttrium was introduced online via a T-piece throughout the experimental process.
Quality control and method validation
To validate the calibration quality in the study, a standard solution comprising 200 µg·L-1 of all analytes served as a quality control (QC) standard. Additionally, the method's accuracy was reinforced by spiking selected samples at concentrations of 50 µg·L-1 and 1 mg·L-1. Both spiked and native samples underwent continuous measurement for over 10 hours, ensuring the robustness of the proposed method.
Results and discussion
Selectivity, sensitivity, and linearity
Table 2 offers a comprehensive overview of the analytes examined in this study, encompassing the chosen wavelengths based on relative sensitivity and interference-free conditions, as well as the achieved analytical figures of merit. Across the entire calibration range, the coefficients of determination (R2) for all analyte wavelengths exceeded 0.9996, as illustrated by the calibration curves in Figure 1. Additionally, the table includes the instrumental detection limit (IDL), derived from triplicate measurements of blank and low-concentration calibration standards, and the method detection limit (MDL) in the original solid sample, calculated by multiplying the IDL with the dilution factor applied during sample preparation. Notably, 43 out of the 45 targeted elements exhibited MDLs significantly below 1 mg·L-1, demonstrating exceptional sensitivity across the entire analyte suite.
Furthermore, if desired, the total lithium content of the samples can also be monitored using this same method, employing a distinct set of non-matrix matched standards and a blank contained in a separate calibration block.


Table 2. List of suitable wavelengths, lowest limits of detections (LOD), R2 values, and method detection limits (MDL) for the individual elements
Accuracy
As previously stated, the samples were spiked with varying concentration levels for distinct analytes to evaluate the accuracy of the method at similar concentrations anticipated for these impurities. Notably, all spike recoveries remained within a range of ±20% around the expected concentration.


Table 3. Spike recoveries (N=8) on Li2CO3 and LiOH samples of 50 µg·L-1 and 1 mg·L-1 spikes. In case no results are given (denoted as - in the table), the spike recovery test was not performed due to the concentration levels found in the samples.
Easily ionized element (EIE) effects
The presence of Easily Ionized Elements (EIE), characterized by their low ionization potential, such as sodium, potassium, or lithium, in a sample can disturb the ionization equilibrium in the plasma. The readily liberated electrons from these EIE then become accessible to other elements in the plasma, altering the balance between ions and atoms. Consequently, this leads to an augmentation in the intensity of atomic emission lines and a reduction in ionic emission lines, thereby modifying the apparent concentration of specific analytes. This phenomenon, classified as chemical interference, can yield erroneous results when non-matrix matched standards are employed (depicted in Figure 2). However, the implementation of matrix matching in this study safeguarded against the occurrence of inaccurate outcomes.

Figure 2. When calibration solutions and real samples are not matrix-matched, easily ionized elements can result in poor and inconsistent internal standard recovery. The data points indicating 100% recovery represent calibration blanks that are intermittently run. As sequences extend over several hours, the recoveries are anticipated to deteriorate further. However, this study mitigates this issue by employing matrix matching, significantly enhancing data stability.
Real sample composition/purity check of Li2CO3 and LiOH raw materials
The findings of the quantitative analysis on the three lithium salts under investigation in this study are consolidated in Table 4. The results demonstrate that the overall impurity levels in these salts align well with the stated purity claims. The primary impurities detected in all samples were alkaline and alkaline earth elements, such as sodium, potassium, magnesium, and calcium, though some common transition metals like chromium, iron, or zinc were also present. Nevertheless, it's noteworthy that the impurity composition may vary significantly even among samples with identical purity grades. For instance, the LiOH sample, certified with an overall purity of over 98%, contained significantly lower levels of calcium and silicon compared to the Li2CO3 sample, which has a certified purity of over 99%, but had higher levels of aluminium and sulfur. This variance could potentially influence the workflows for further processing of these raw materials. For a broad spectrum of analytes, the impurity levels are below the detection limit of ICP-OES, indicating a need for an analytical technique with even higher sensitivity, such as inductively coupled plasma combined with mass spectrometry (ICP-MS).
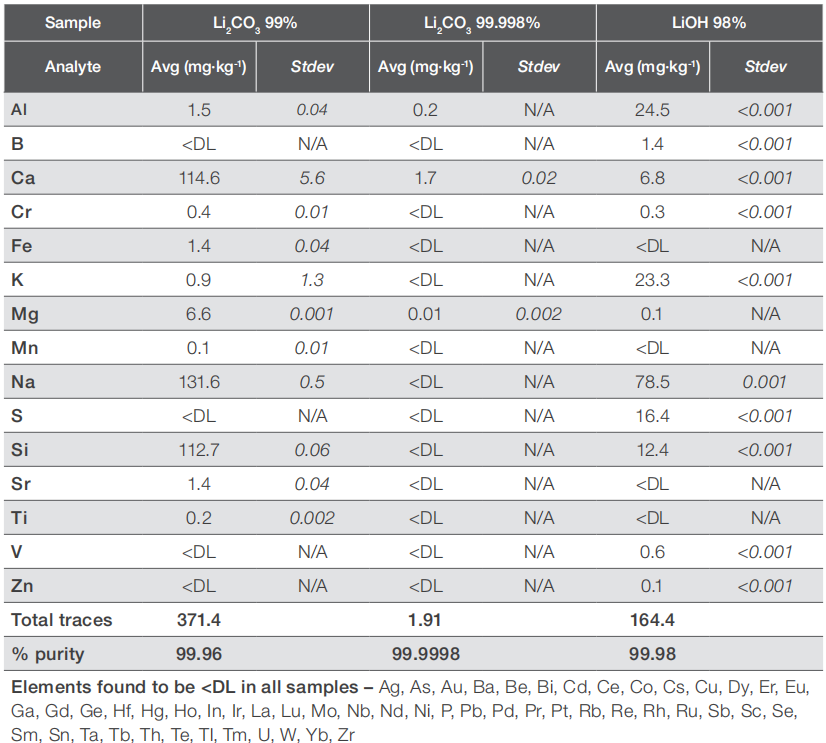
Table 4. Trace elemental composition of the raw material samples measured in this study
Robustness validation over a typical working day
The developed method underwent rigorous testing and validation for accuracy over an extended period by conducting a twelve-hour robustness test for continuous measurements. This simulation mirrors a real-world industrial scenario where hundreds of such samples require uninterrupted monitoring to guarantee consistent product quality and homogeneity. The robustness test encompassed all three samples of Li2CO3 and LiOH, both in their native state and spiked aliquots. The experimental sequence commenced with the calibration block, encompassing blanks and standards, followed by an initial QC check (ICV = Initial Calibration Verification). Subsequently, the QC sample was analyzed after every 20 unknown samples to ensure consistency.
The outcomes indicate no significant signal drift or QC failures throughout the experimental duration. The recovery of the internal standard, QC sample concentration recovery, and spiked concentration recoveries remained stable throughout the analysis. Specifically, the internal standard recovery remained within the range of 90-100% (Figure 3). Similarly, the QC recoveries for all analytes were within the acceptable range of 80-110%, with the majority clustering within the narrower range of 85-100% (Figure 4).

Figure 3. Excellent internal standard recovery throughout the 12-hour robustness test analysis, with calibration solutions matrix matched to the real samples

Figure 4. QC recoveries during the robustness test analysis. The red double line marks the 80-120 ± 5% interval.
Conclusions
This application note introduces a swift, sensitive, precise, and resilient method for analyzing various common lithium-ion battery raw materials, particularly Li2CO3 and LiOH. The iCAP PRO XP ICP-OES Duo instrument facilitates simultaneous measurement and characterization of 45 trace analytes in both sample types, offering end-users an elegant and efficient approach for reliable daily measurement of hundreds of samples.
• In this study, both Li2CO3 and LiOH salts were analyzed using a unified method that simultaneously covers 45 elements with the iCAP PRO XP ICP-OES Duo. The MDLs (Method Detection Limits) were below 0.01 mg·L-1 for 19 elements, under 0.1 mg·L-1 for 23 elements, and slightly over 1 mg·L-1 for the remaining 2 elements.
• Owing to the simultaneous data acquisition for all analytes in a single exposure, the multi-element analysis was completed rapidly, taking only 2 minutes and 24 seconds per sample (inclusive of three repetitions, uptake, and wash).
• The method's accuracy and precision are evidenced by precise spike recovery on authentic sample matrices, along with exceptional QC recovery and stable internal standard recovery throughout a 12-hour robustness test. The EIE (Enhanced Ionization Effect) from the high lithium concentration in the matrix did not deteriorate data quality due to the calibration standards and blanks being matrix-matched to the real samples.
• The uninterrupted analysis spanning twelve hours highlights the remarkable robustness of the iCAP PRO XP ICP-OES Duo in handling lithium salts of diverse compositions.
Aladdinsci: https://www.aladdinsci.com/